
Interactive Data Dashboards
Here VDOE presents a collection of interactive and intuitive visual representations that aim to inform educators and the general public about important educational data. This growing library of visualizations provides a comprehensive overview of various educational metrics, allowing users to explore and gain valuable insights. These data visualizations offer an informative experience for educators seeking data-driven decision-making tools and the general public interested in understanding Virginia’s educational landscape.
Regional Centers Enrollment and Self-Reported Programs’ Participation Dashboard
The Regional Centers Enrollment and Self-Reported Programs’ Participation dashboard shows the variety of opportunities and programs that school divisions provide to students across the Commonwealth of Virginia. These optional opportunities to participate in enriching academic, career and technical, visual, and performing arts activities are alternatives beyond those normally available in the students' home schools. There are three visualization views for each dashboard for the 2023-2024 school year.
ESSER Funds Allocation Dashboard
Virginia’s ESSER Data Dashboard is a user-friendly tool to visualize the use of federal pandemic funds allocated to the Commonwealth’s local school divisions through the Elementary and Secondary School Emergency Relief Fund (ESSER). This funding was designed to provide assistance to schools in response to the impacts of the COVID-19 pandemic, such as student learning loss and the need for student learning acceleration and includes formula funds as well as state set-aside funds provided to divisions for targeted needs.
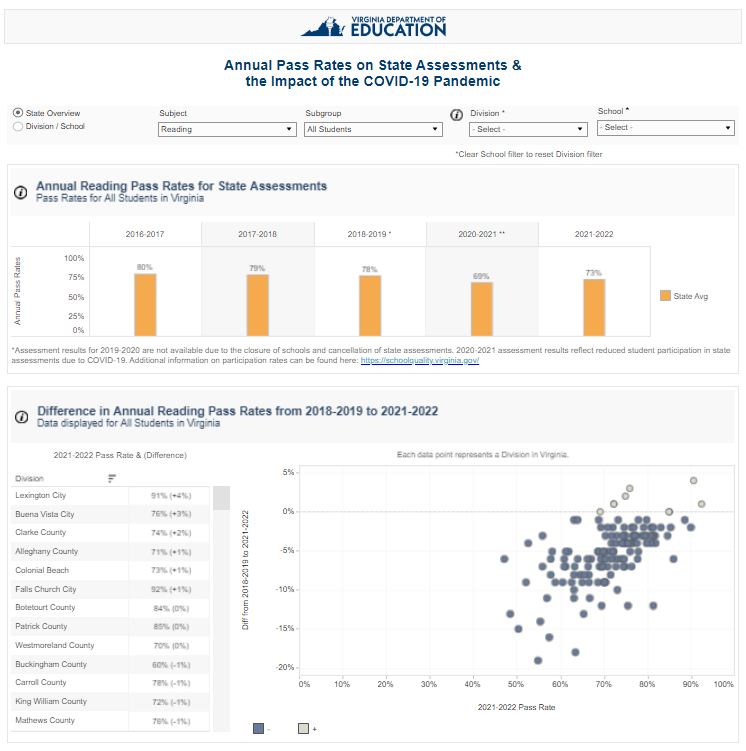 Learning Needs Dashboard
Visualizing trends in annual pass rates on state assessments before, during, and after the COVID-19 pandemic can inform understanding of students’ learning needs. The visualization below shows annual pass rates on state assessments since 2016-2017 through 2022-2023. We can now utilize this interactive dashboard to toggle dynamically between pandemic years and pre and post pandemic years and compare the changes. Use the bar chart to compare annual pass rates for specific schools, divisions, and student groups of interest. Use the scatterplot to see the relationship between pre and post pandemic changes in SOL scores and SOL pass rates.
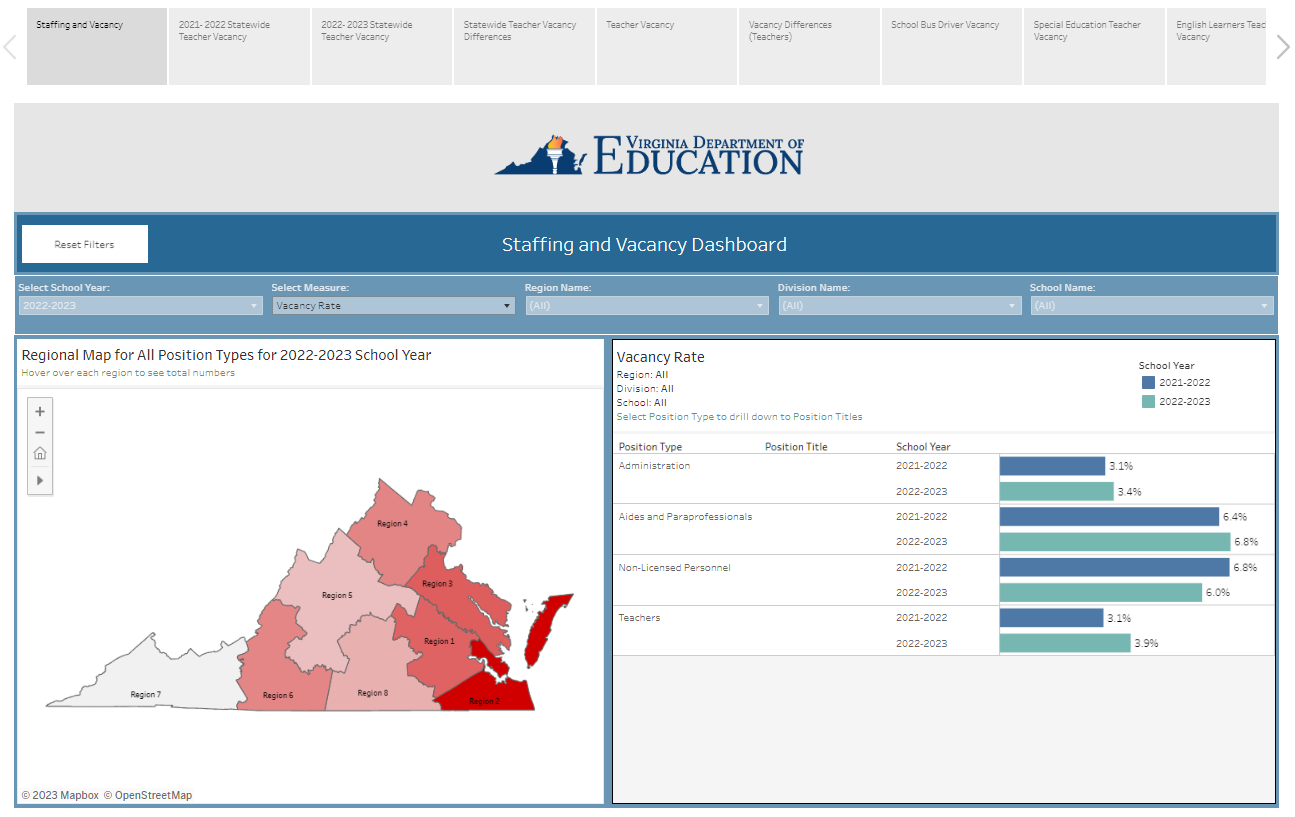 Teacher & School Staffing Vacancy Dashboard
The Teacher & School Staffing Vacancy Dashboards are user-friendly tools to visualize critical statistics on the public K-12 teacher and school staffing shortages in the Commonwealth of Virginia. The visualizations show the total positions available, the unfilled positions, and vacancy rates for teachers and school staff for the 2021-2022 and the 2023-2024 school years. The statistical data is provided at the regional, division, and school level to support and improve teaching and learning in the Commonwealth.
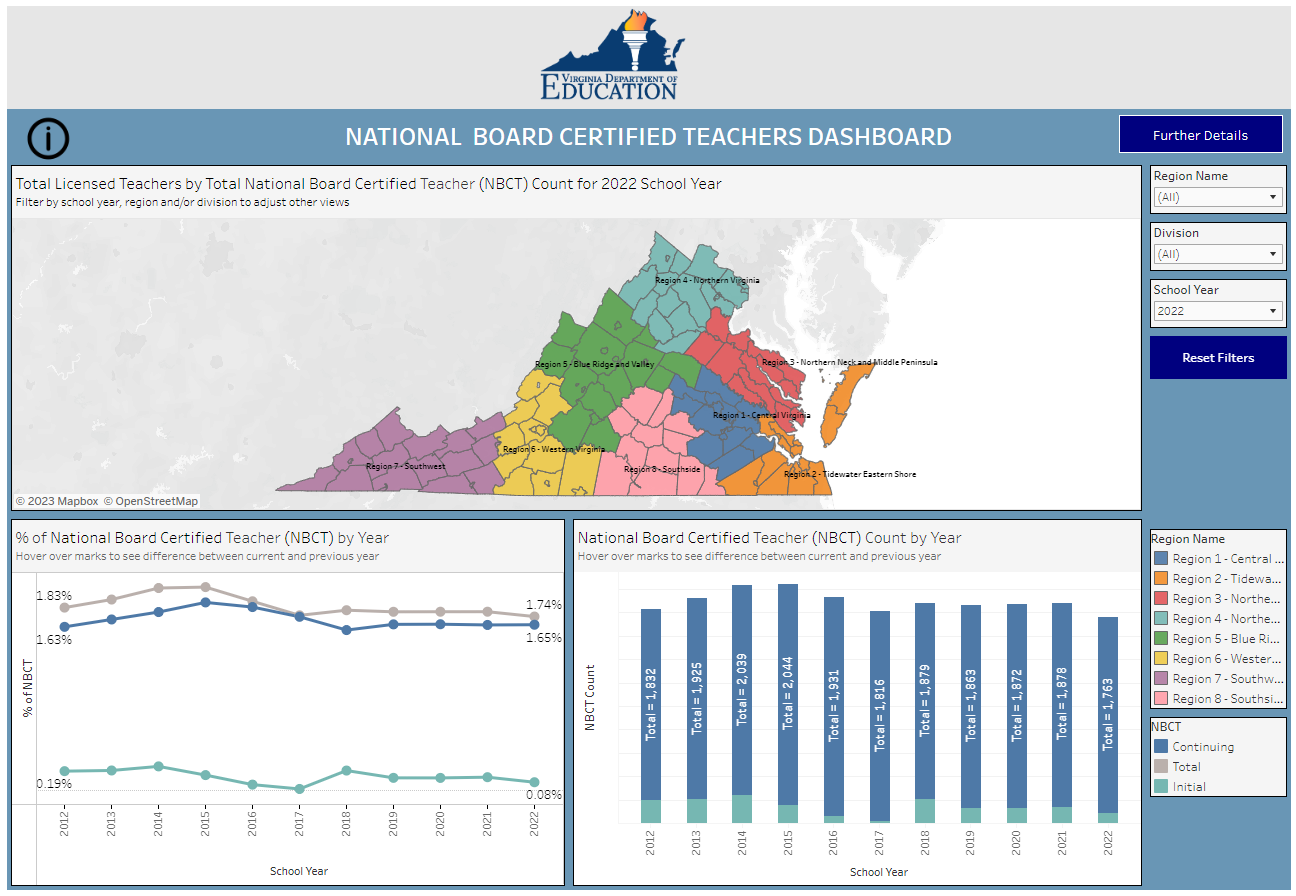 National Board Certification Teacher Dashboard
These interactive dashboards display data on National Board Certified Teachers (NBCT) in the state of Virginia at the regional, division, and school level. The visualization of trends in NBCT over the years can help understanding teacher growth in career advancement. The visualizations show annual NBCT participation counts and rates since 2011-2012 through 2022-2023.